

2. The Fortune at the Heart of LP Returns Data
Spotting a Pattern in the Data
This inquiry started with recurring anecdotes — shared among top-performing fund managers (several of whom feature in this paper) — that the enduring winners in venture portfolios tend to tackle deep, structural problems. Not hype-driven gadgets or fleeting trends, but fundamental, societal, and planetary pain points.
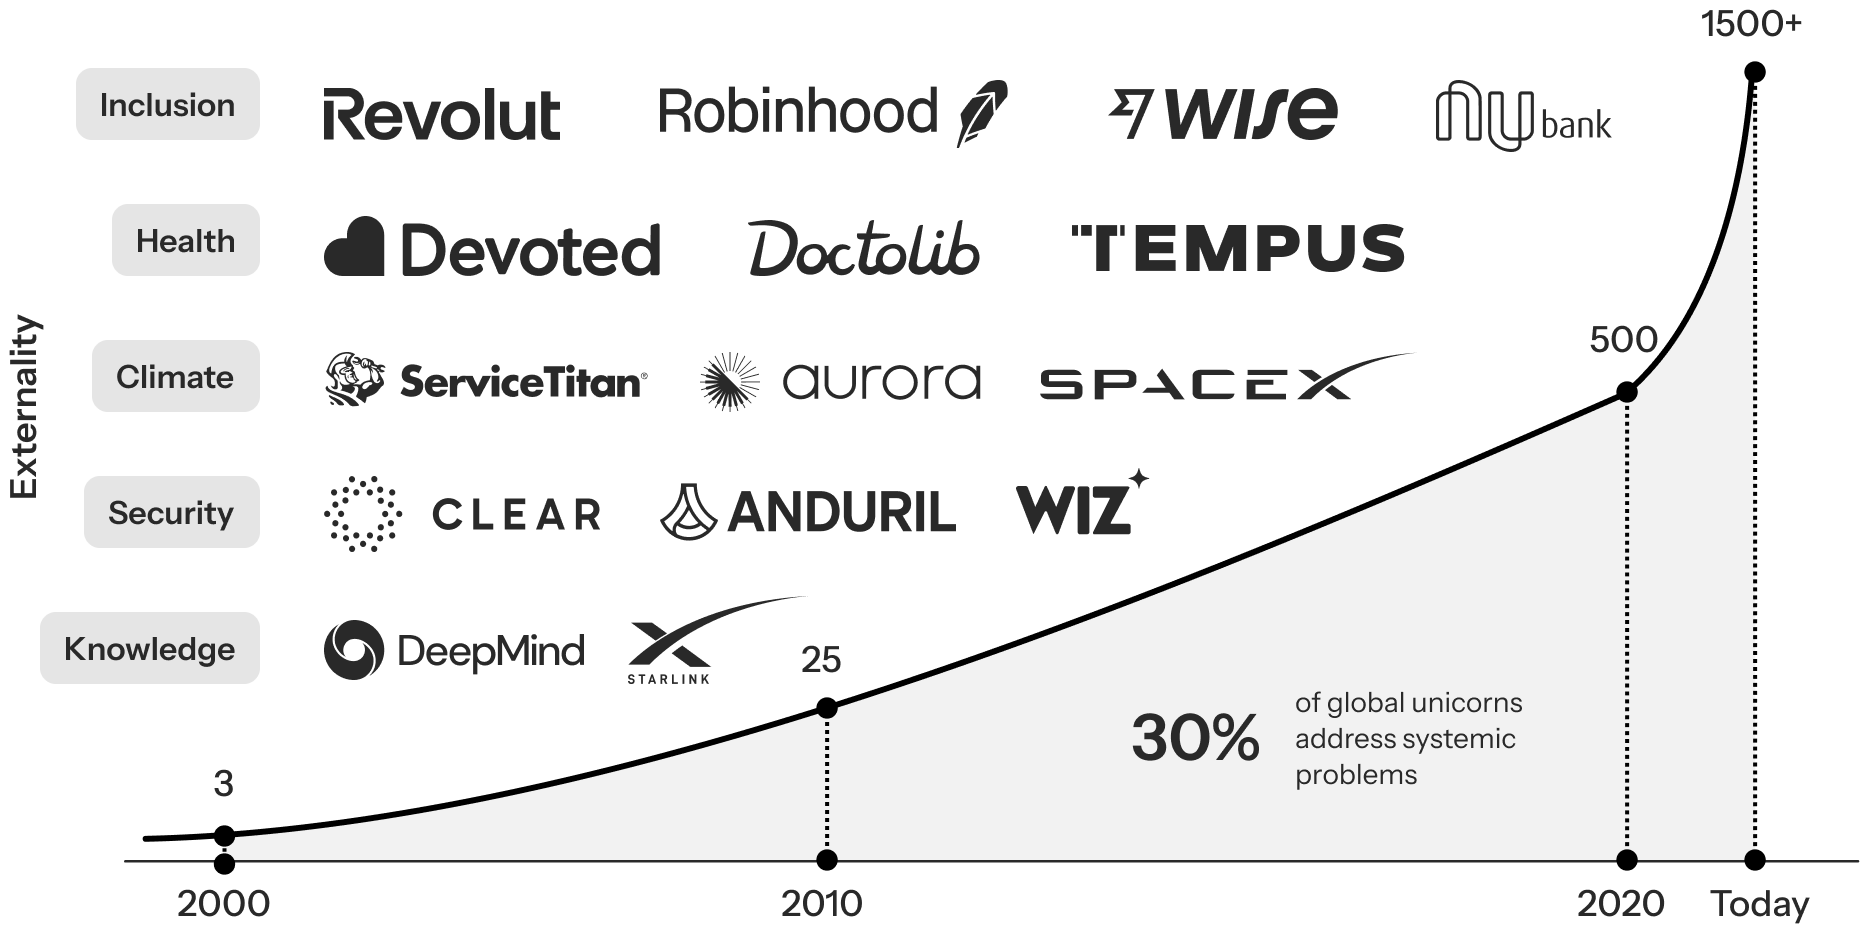
This intuition was first tested through analysis of the Crunchbase Unicorn Board, a globally recognized ledger of the world’s most successful private companies. As the most visited startup and venture data platform, Crunchbase provides real-time intelligence on company growth trajectories, funding patterns, and market trends. Its curated Unicorn Board tracks over 1500 venture-backed firms valued at $1 billion or more as of Q1 2025, offering a dynamic view into how disruptive business models scale within the competitive VC ecosystem.
On initial review, one signal stood out: roughly 30% of the companies categorized as Benevolent Disruptors account for a disproportionate share of total enterprise value (see Figure 3). This early finding affirmed what many investors have long sensed but lacked the data to verify.
Figure 3: Example Global Unicorns Solving the World’s Biggest Problems
Summary: 30% of the world’s most valuable tech companies are Benevolent Disruptors; ventures built to address structural problems across sectors like health, inclusion, climate, knowledge access, and security. This is a growing trend, as solving systemic problems becomes a dominant pathway to outsized value creation.
But even clear-cut patterns, like those surfaced in the Crunchbase Unicorn Board, aren’t enough for capital allocators making high-conviction, long-term investment decisions. While Crunchbase provides valuable visibility into the most successful private companies globally, it captures only part of the picture:
- The analysis reflects a point-in-time snapshot, not a longitudinal study of outcomes over extended periods, meaning it does not guarantee a repeatable investment formula
- The data measures company valuations, not actual returns to investors; a company’s value today can rise or fall sharply, and only returns or sustained long-term value retention offer true evidence of success
- Much of the observed value creation has already been captured. While this supports the underlying pattern, it also underscores the need to focus on building exposure to emerging Benevolent Disruptors earlier in the cycle
So, the question remained: do funds that back more Benevolent Disruptors systematically outperform their peers? Or was this just a retrospective bias applied to already-successful firms? To test whether backing Benevolent Disruptors delivers consistent, predictive upside to venture funds, access to the one thing venture markets seldom make public was needed: actual fund-level returns data.
2.1. The VenCap Dataset
”“One of the most powerful advantages we have at VenCap is our proprietary dataset covering the leading VC funds and the companies they back. This dataset tells the true story of venture capital – one that cuts through the hype and competing narratives to reveal the true drivers of venture returns. The insights gained from this data aren’t just “nice-to-have”. They are essential in separating myth from reality in an increasingly noisy asset class.”
David ClarkeChief Investment Officer, Vencap International
Lacking access to large datasets of fund-level data is likely the reason that investors and allocators have not been able to spot the extraordinary pattern in the data that this paper highlights. This paper draws on a uniquely privileged source: proprietary access to one of the most extensive and detailed datasets in global venture capital, provided by VenCap International. Founded in 1987, VenCap is one of the most established and enduring venture capital fund-of-funds globally. The dataset comprises detailed performance data across 500 venture capital funds and over 14,000 underlying portfolio firms across a 40-year period, granting it unmatched visibility into the evolution of the private market landscape.
What makes this dataset extraordinary is not only its scale and breadth, but also its historical depth. Spanning multiple economic cycles, technological shifts, and geopolitical transitions, it provides a longitudinal view of how value is created in venture capital over time. This long-range perspective enables a far more robust understanding of what consistently drives returns, regardless of prevailing market narratives or temporary hype cycles.
Equally important is the nature of the data itself: returns tracked at the individual fund-level. This kind of transparency is extraordinarily rare in venture capital. Fund managers and allocators only have access to the funds they manage or invest in and therefore cannot have the broader perspective this dataset provides. Aside from anonymized benchmarking tools such as those provided by Cambridge Associates, there are virtually no public sources that offer this level of empirical insight. As such, the VenCap dataset constitutes one of the few publicly shared windows into the actual distribution of venture outcomes. For the first time, it is possible to move beyond abstract theories and identify, with precision, what creates long-term value in the venture ecosystem.
For an audience of practitioners evaluating the financial viability of fund strategies and alternatives, this kind of high-fidelity data is invaluable. Anchored in the lived realities of top-tier venture portfolios, it provides unparalleled visibility into the “engine room” of venture capital. This perspective enables a structural rethinking of how capital allocators might identify and systematically back the next generation of enduring winners.
In sum, it is only through access to such a large and long-term dataset that investors and allocators can spot this crucial pattern in the data.
The Power Law Principle
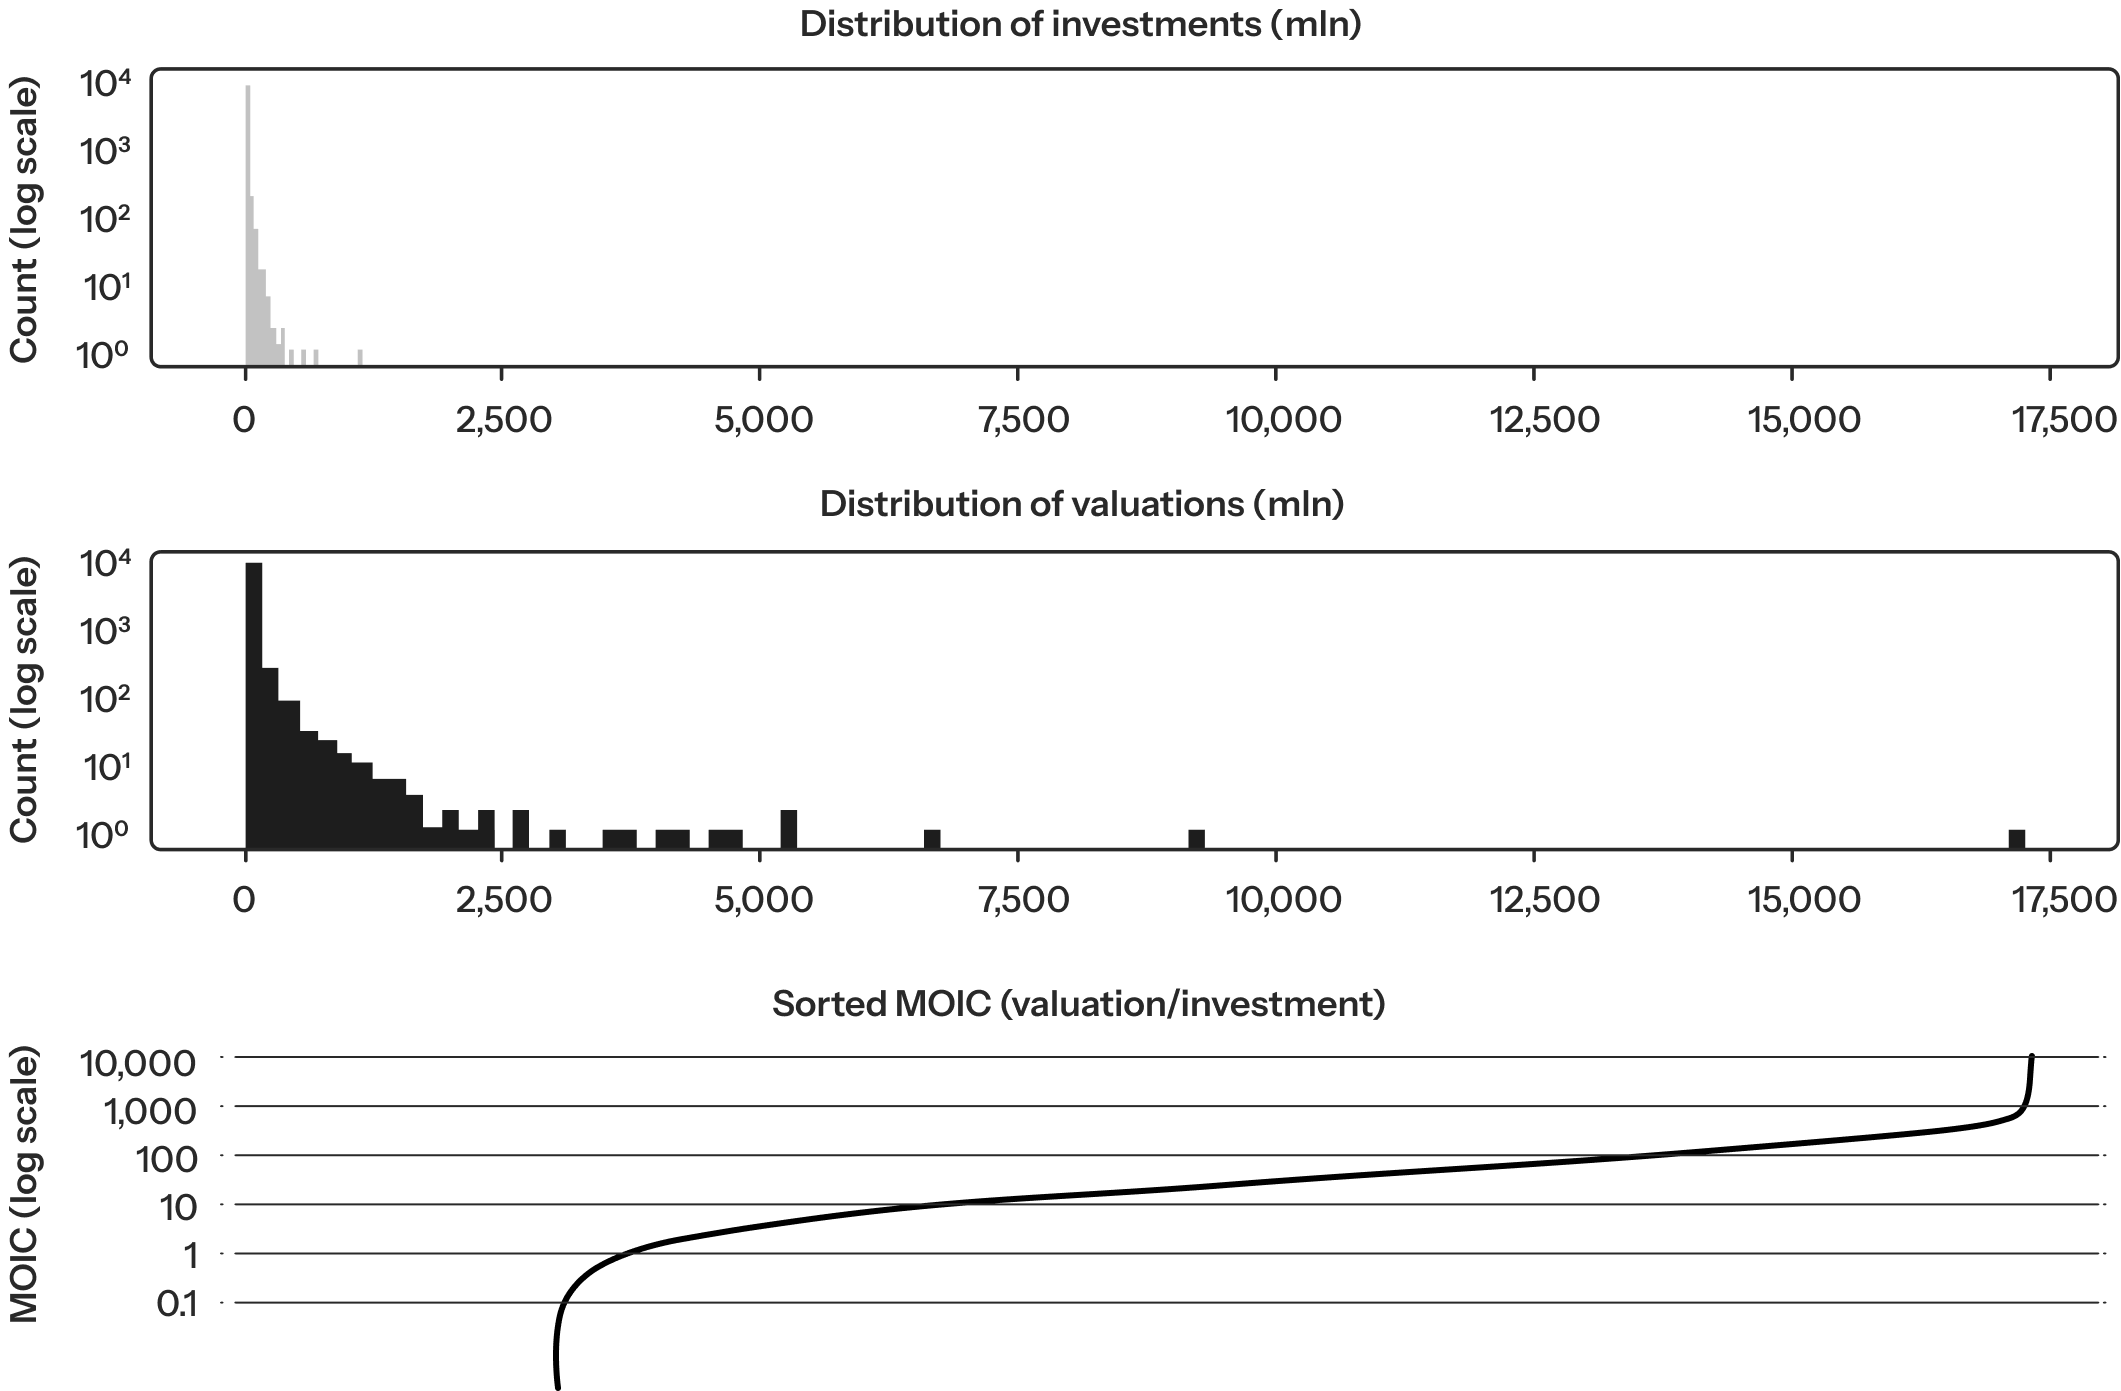
As Peter Thiel said, “The biggest secret in venture capital is that the best investment in a successful fund equals or outperforms the entire rest of the fund combined”.4 Venture capital isn’t a game of averages. It’s a hunt for anomalies. The “power law” defines the landscape: a tiny slice of investments — often fewer than 5% — drives more than half of a fund’s total returns. In the VenCap dataset, this pattern is constant (see distribution in Figure 4). Most bets don’t return capital, but a few rare outliers deliver exponential gains.
For allocators investing in venture as an asset class, this skews traditional metrics like mean and median, making simple averages a poor guide to performance. As Sebastian Mallaby underscores in The Power Law, venture success hinges not on picking safe bets, but on backing the outliers early — the companies that reshape industries and define new categories altogether. That’s why this analysis focuses on both population-level trends and on identifying the characteristics that consistently distinguish outliers. Outperformance is not random. It follows recognizable patterns, and this paper sets out to measure them systematically.
Figure 4: The Non-normality of Venture Capital Returns in the VenCap Data Set
2.2. Methodology: Leveraging the Wisdom of the Crowd
The following was analyzed and evaluated at both fund and portfolio-level:
- The concentration of Benevolent Disruptors within:
i) The portfolios of private funds at the population or a aggregate level
ii) Outlier companies that drove the majority of a given fund’s returns -
Performance metrics at a fund and company level, set across both the population and outlier levels, which highlights the return an investor receives for every dollar invested, specifically Total Value to Paid in Capital (TVPI) and Multiple on Invested Capital (MOIC)
To assess the performance of Benevolent Disruptors in the VenCap dataset, each company was coded independently by a team of researchers at Imperial College London. Performance information was redacted to mitigate bias. The aim was to approach each company through a deliberately simple, common-sense lens, rather than applying rigid ESG frameworks or investment taxonomies. This ‘crowd-sourcing of common sense’ approach was core to the methodology. In doing so, theoretical frameworks were intentionally removed and coders were invited to rely on independent judgment. The only requirements were: (i) independence from the investment process or any returns data on the company, and (ii) a clear understanding of what the business actually does, both of which were ensured.
Each company was assessed and codified against two simple criteria, which link business models to widely accepted systemic problems:
-
Benevolent Disruptor Relevance: Does the company aim to solve a systemic problem and/or drive positive change for society and the planet – specifically across five commonly accepted global externalities?
-
Business Model — Problem Alignment: Is the relationship between its business model (the core driver of revenue generation) and the problem (e.g. CO2 emissions) direct (e.g. solar panels offering fossil fuel alternative) or indirect (e.g. Zoom reducing travel emissions)?
Companies who do not address a systemic problem or drive positive change, either directly or indirectly, are termed traditional venture investments for the purpose of this analysis. All coding underwent structured quality control, including independent spot-checking focused on the primary value–drivers. Final performance analysis and correlations across categories was carried out by an experienced data scientist.
By removing conventional frameworks and applying a crowd-sourced, common-sense lens, a different — and arguably more authentic — picture of what constitutes long-term, real-world value emerges. This method lies at the heart of our thesis. In a landscape where frameworks often lead capital to converge on the same limited asset base, this wisdom-of-the-crowd approach opens a new frontier for identifying overlooked investment opportunities with enduring potential.
By prioritizing business model outcomes rather than frameworks this approach captures businesses that actually solve for systemic challenges, including those that do so indirectly or across multiple systems. While broader discretion always carries some risk, the alternative is worse: rigid frameworks that exclude meaningful solutions and fail to evolve with real-world change. If frameworks are rigid it will always be political as to what is and is not included. And it is this politicization that has resulted in a backlash against the ESG movement. Further, as this paper will demonstrate, it is counterintuitive for bad actors to exploit this model in practice, as doing so would mean missing out on the very upside created by solving structural problems.
2.3. Key Findings: Big Problems are Big Business
Evaluation of the data has surfaced a remarkable finding: the companies and funds backing them delivering the highest returns are solving entrenched, structural problems for society and the planet. Across sectors, geographies, and decades, the data tells a consistent story: companies addressing real-world challenges outperform traditional venture investments on returns, strike rate, and fund-level outcomes. And the highest returns of all come from the Indirect Benevolent Disruptors – those quietly driving systemic change through infrastructure, platforms, and tools, rather than through obvious or headline-grabbing impact plays.
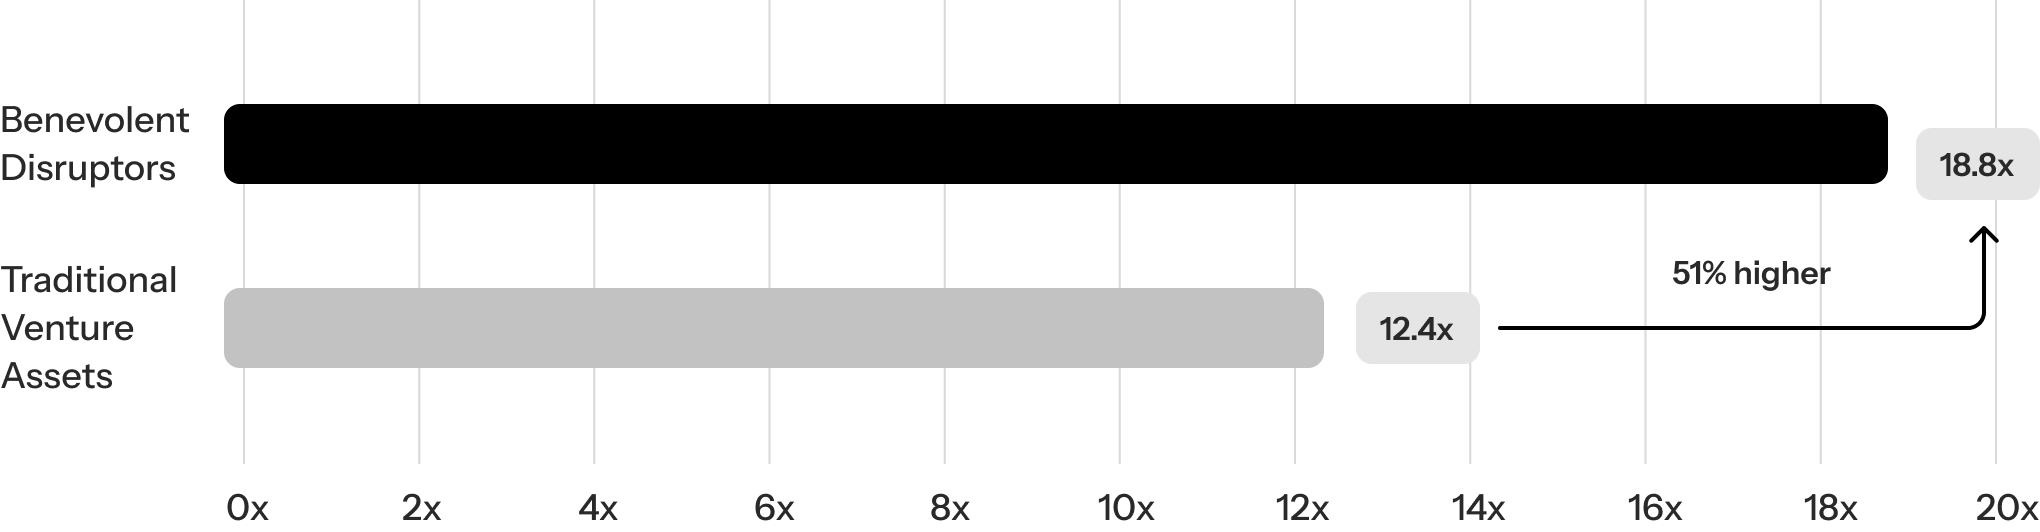
a) Benevolent Disruptors Drive Superior Returns
Benevolent Disruptors consistently outperform traditional venture assets at the outlier level. For every $1 invested in traditional VC investments, investors get $12.40 back. But with Benevolent Disruptors, it is increased to $18.80 – representing 51% higher returns.
Figure 5: Returns per Dollar Invested – Benevolent Disruptors vs Traditional Venture Investments
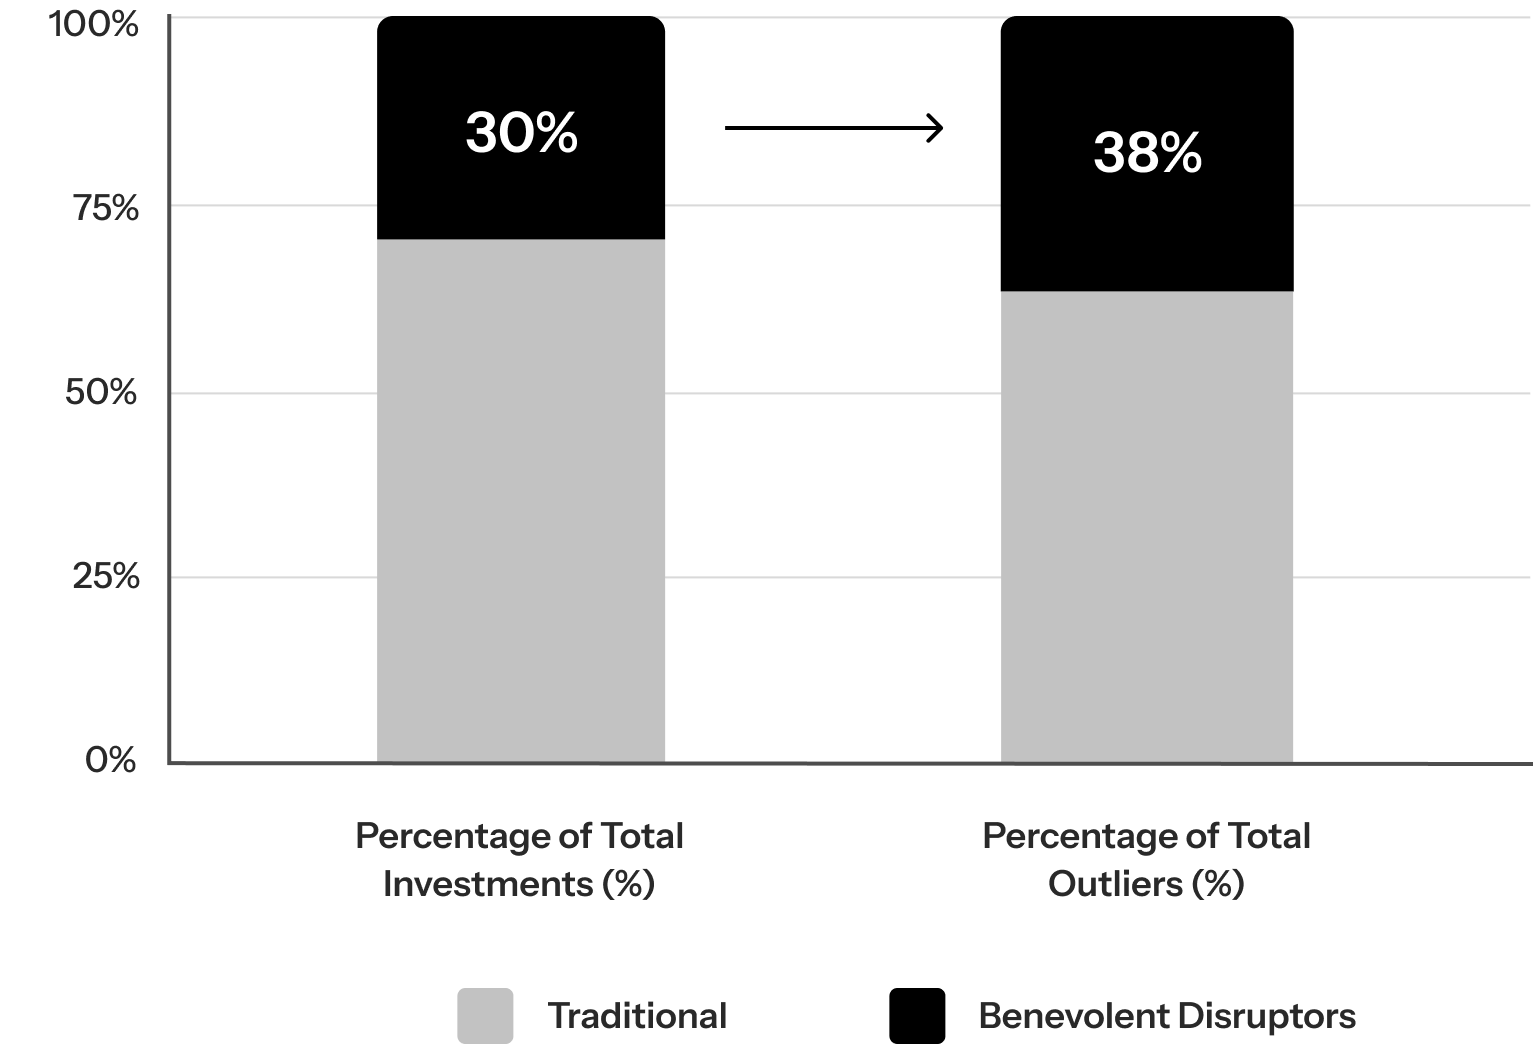
b) Higher Strike Rate
Although they make up less than 30% of technology portfolios or the total universe of venture-backed companies, they account for 38% of top-performing outliers. This concentration signals a measurable performance edge: investing in Benevolent Disruptors increases the probability of backing a breakout success by 27%. In a market defined by power-law dynamics, this uplift represents a significant improvement in a manager’s chances of delivering exceptional returns.
Figure 6: Benevolent Disruptors as a % of Total Investments and Outlier Samples
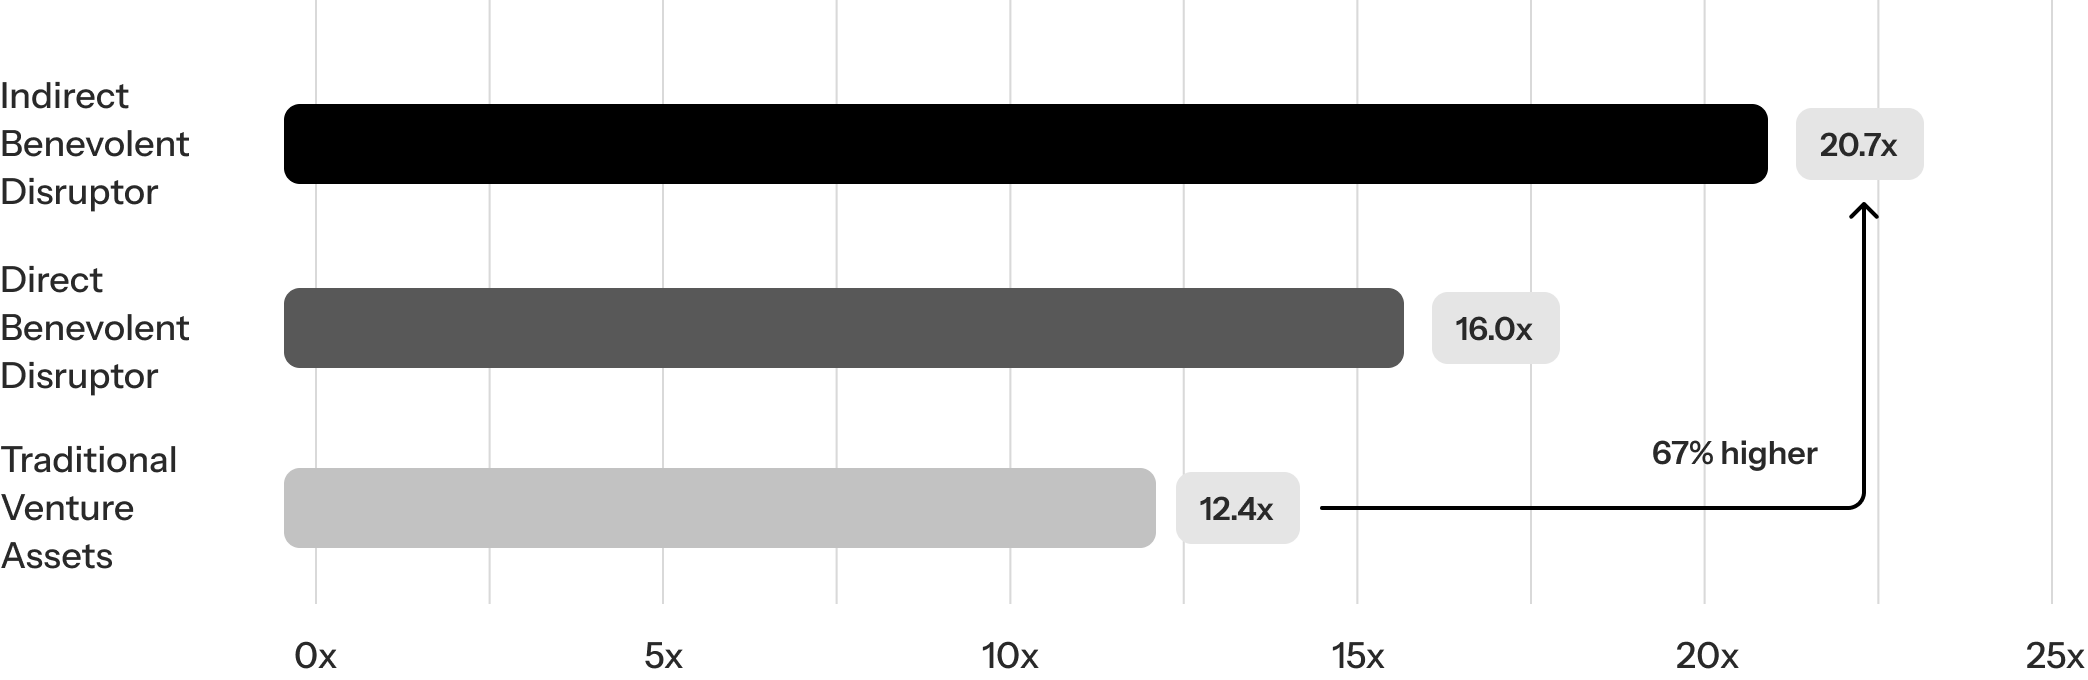
c) Hidden Winners Outperform
The biggest winners at the outlier level are the companies whose business models indirectly affect or enable positive change (see figure 16 for explanation). These Indirect Benevolent Disruptors generate $20.70 for every $1 invested – 67% higher than traditional VC investments and 30% higher than Direct Benevolent Disruptors.
Figure 7: Indirect Benevolent Disruptors Generate the Highest Return per Dollar Invested
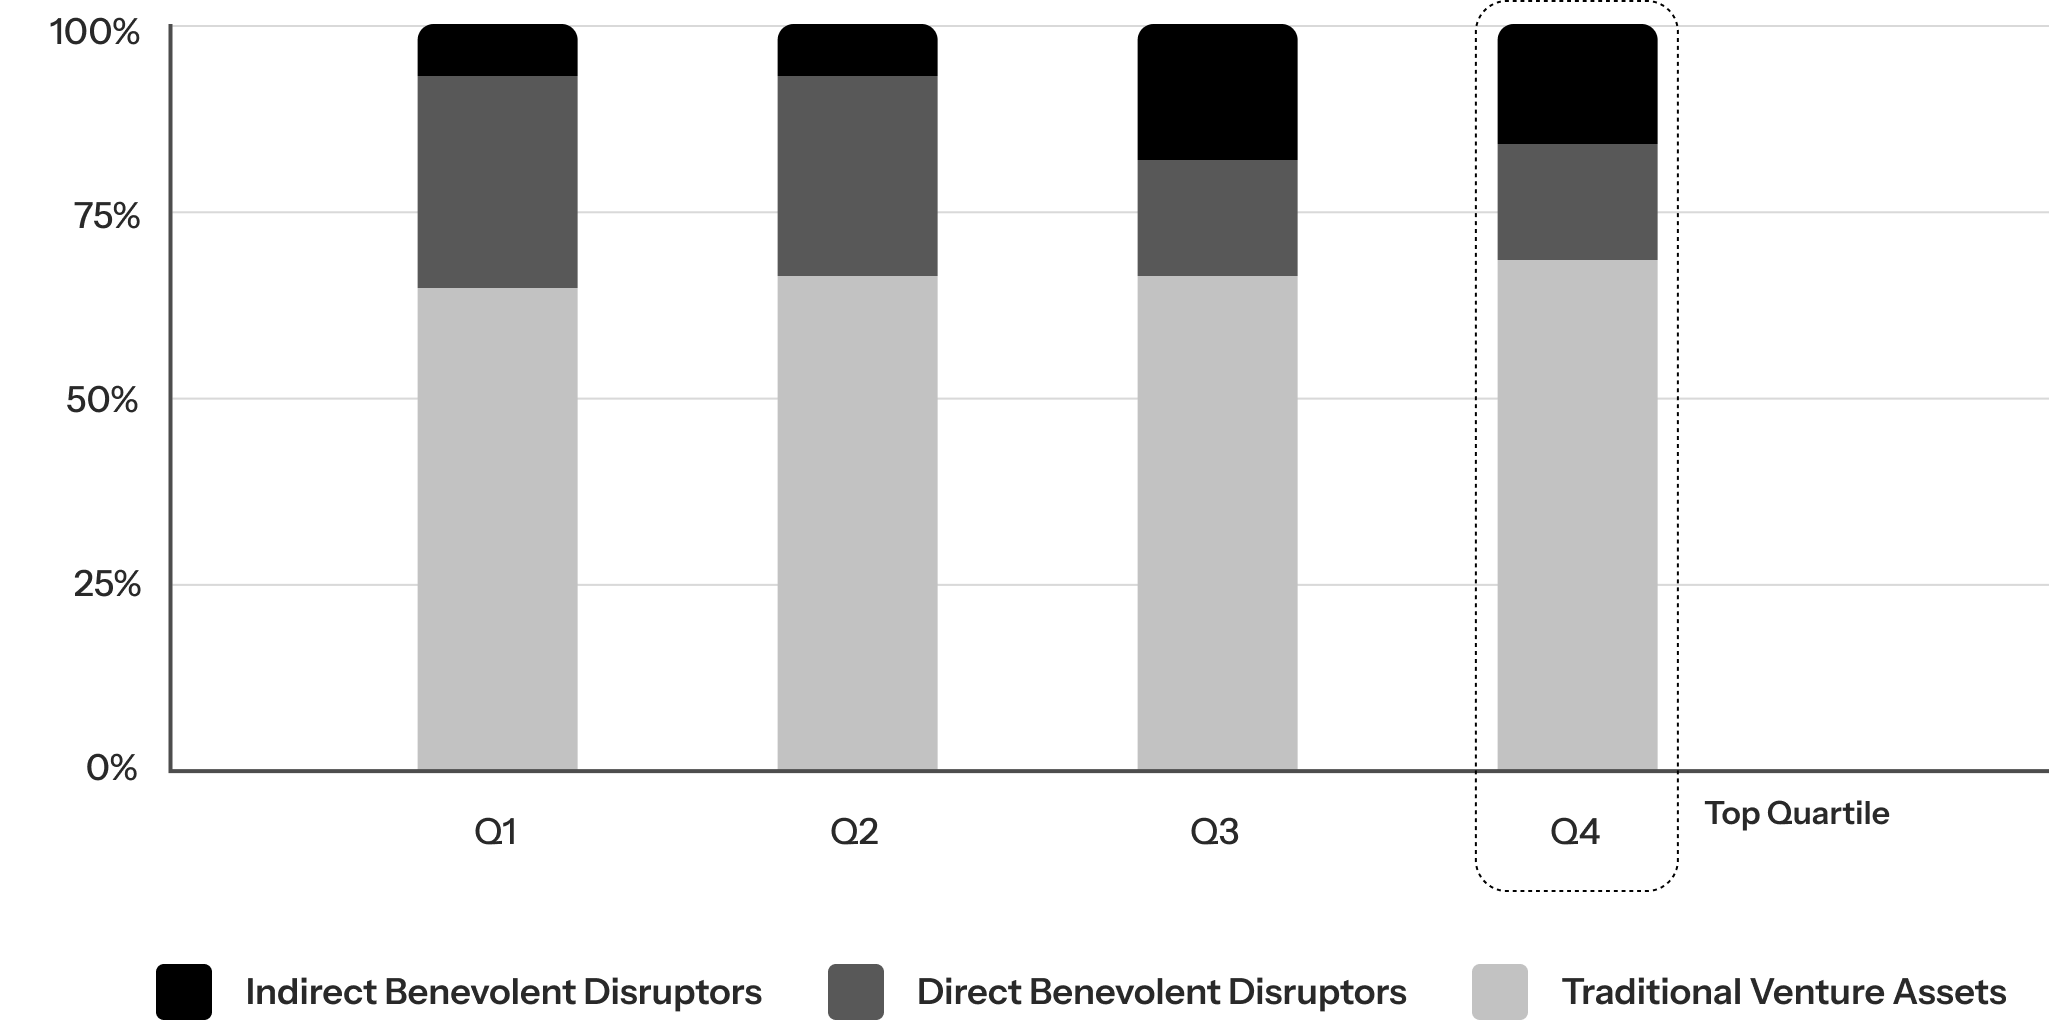
Indirect Benevolent Disruptors are associated with top-tier fund performance. Indirect Benevolent Disruptors don’t just outperform at the company level: they also show up more frequently in top-quartile fund portfolios. In the best-performing funds, the concentration of Indirect Benevolent Disruptors nearly doubles versus what was seen in the bottom-quartile of VC funds.
Figure 8: Concentration of Benevolent Disruptors across Venture Funds by Performance Quartile
2.4. Drilldowns: Where Do you Find Benevolent Disruptors?
a) By Problem
Figure 9: Aggregate MOIC and Number of Companies by Problem Genre
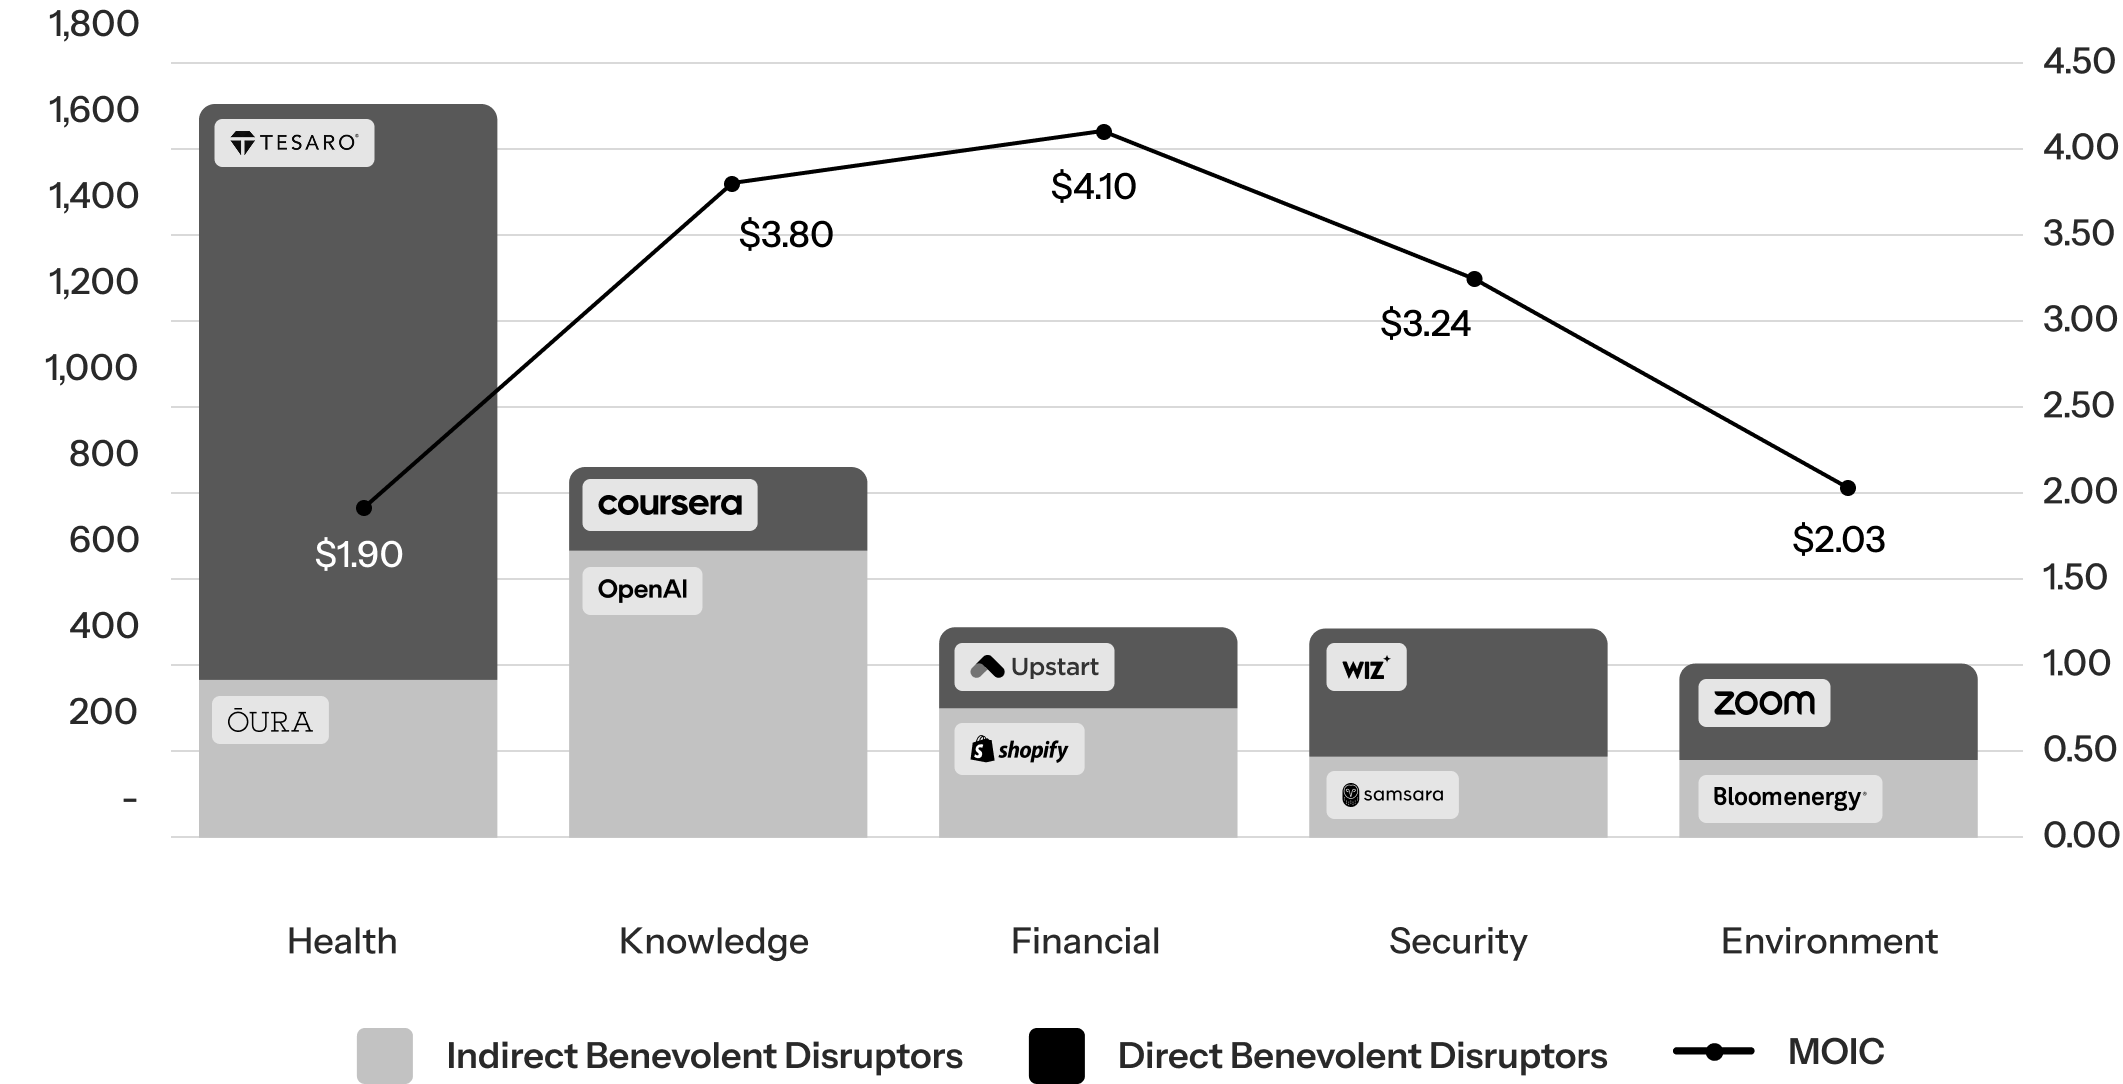
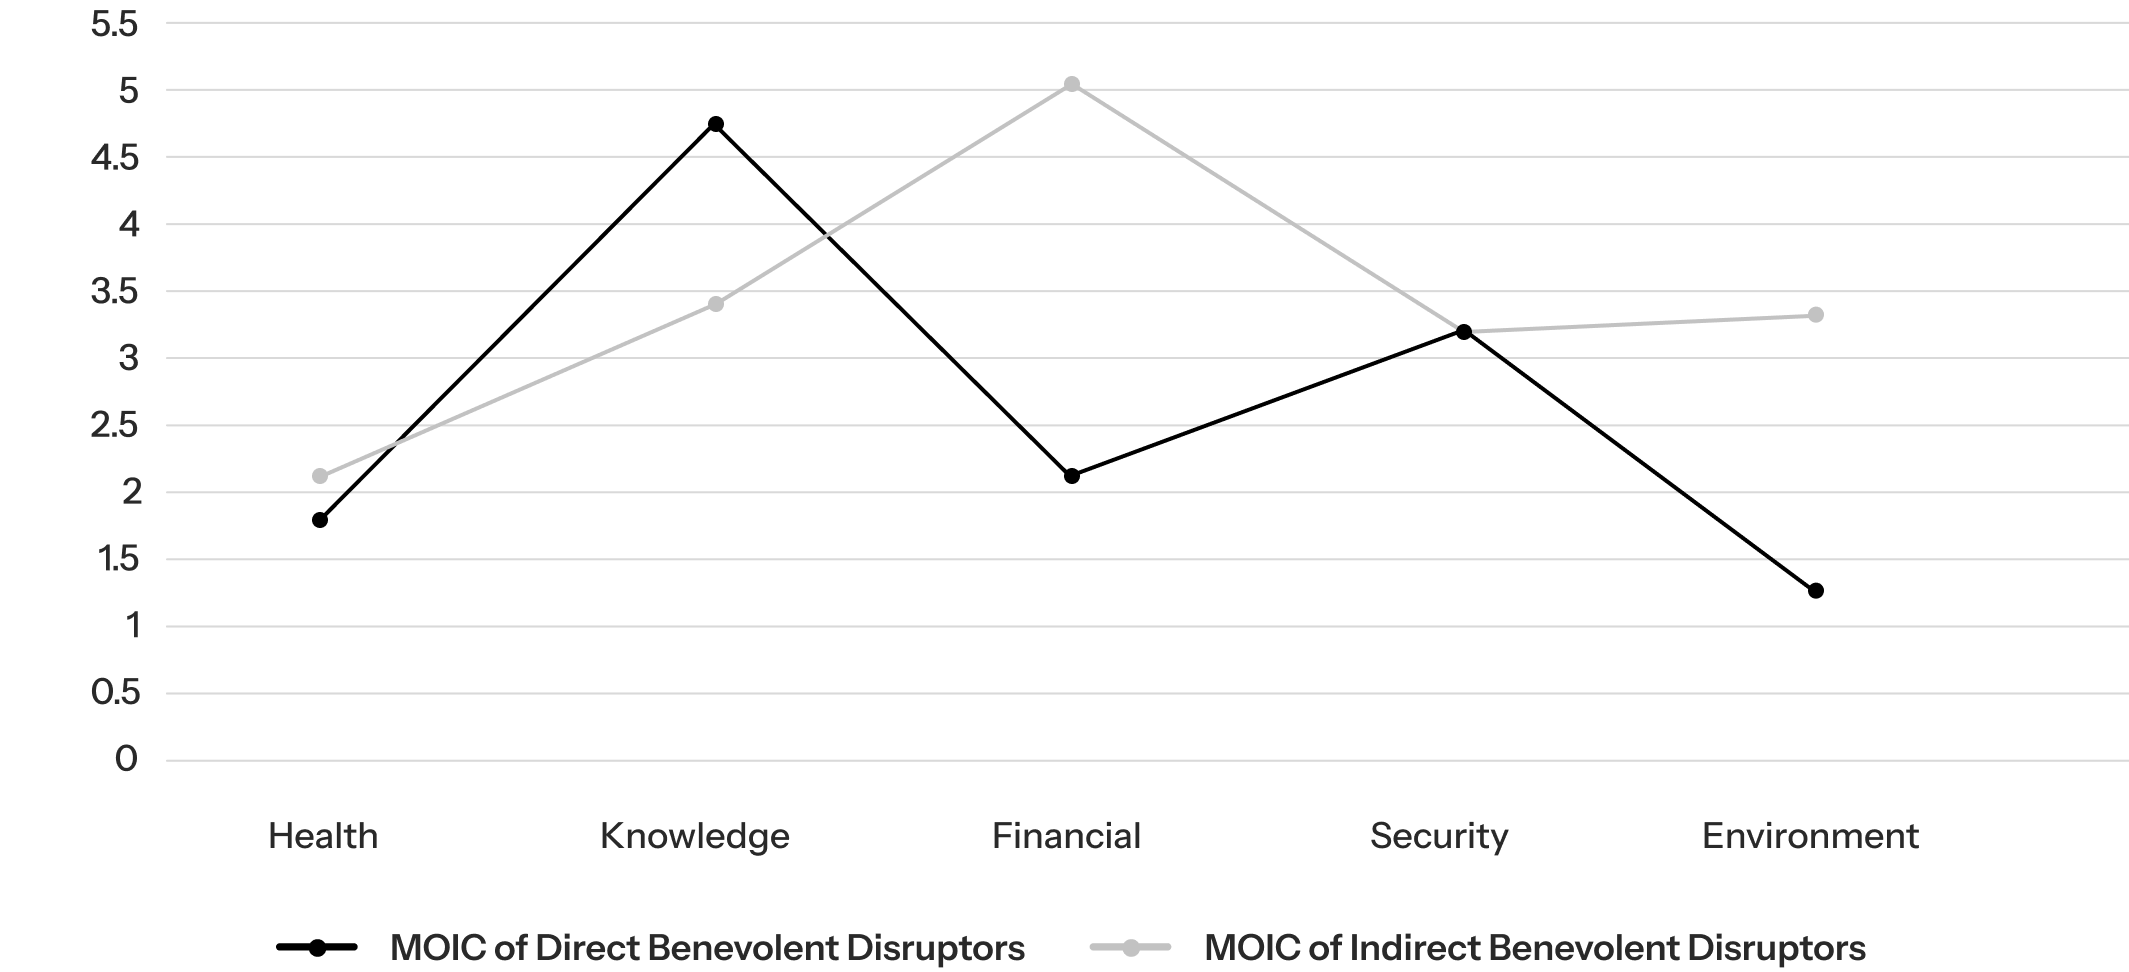
Figure 10: MOIC by Problem Genre, divided by Direct and Indirect Effect
The above charts analyze returns across the five major problem genres — Health, Knowledge Access, Financial Inclusion, Security, and Environment — based on data from Benevolent Disruptors working in each space.
- Figure 9 provides a high-level view: it combines the number of Benevolent Disruptors per category with the average MOIC (Multiple on Invested Capital), illustrating which types of problems attract the most activity and which deliver the strongest aggregate returns
- Figure 10 breaks this down further by comparing the business models’ Direct vs. Indirect mediation effect on the problem it addresses. The data reveals a consistent pattern: Indirect Benevolent Disruptors can generate significantly higher returns, especially in Financial Inclusion and Environment
Together, these charts underscore a key insight for allocators: some of the most durable and mispriced opportunities emerge not just from what problem a company tackles, but how it chooses to solve it.
-
Healthcare is dominated by direct interventions with diagnostics, treatment, and care delivery dominating the category. It also has the highest volume of companies in the dataset, reflecting the sector’s traditional alignment with “impact”. However, it delivers the lowest capital efficiency, with an average MOIC of $1.90 per $1 invested
-
Mediation Effect: Direct Benevolent Disruptors return $2.13; Indirect return $2.19, a negligible difference that reflects the sector’s entrenched costs and regulatory barriers, regardless of approach
-
-
Knowledge Access includes companies that expand access to how people learn, connect, and participate, often through data infrastructure, AI, or digital platforms. While moderate in volume, it is a clear outperformer, returning $3.80 per $1 invested on average
-
Mediation Effect: Indirect models excel here, returning $4.69 vs. $3.44 for Direct and demonstrating the superior efficiency of scalable enablers, such as data infrastructure and AI platforms, that allow access at scale
-
-
Financial Inclusion addresses access to credit, capital, and opportunity, especially in underserved or emerging markets. It combines high volume with the highest MOIC in the dataset at $4.10 per $1 invested
-
Mediation Effect: The gap is stark: Indirect Benevolent Disruptors (e.g. embedded finance, digital ID, credit rails) return $5.01, while Direct models return just $2.19 — highlighting the compounding advantages of systems-level financial infrastructure over end-user financial services alone
-
-
Security encompasses digital and physical protection, from cybersecurity and identity verification to secure cloud infrastructure. It sits mid-range in volume but performs strongly, with a MOIC of $3.20 per $1 invested
-
Mediation Effect: Direct and Indirect models return $3.21 and $3.28 respectively, suggesting consistent demand across both infrastructure and user-facing protection in an increasingly digital world
-
-
Environment sees the lowest number of Benevolent Disruptors, challenging the perception that climate tech is overcrowded. Aggregate returns are more modest at $2.00 per $1 invested
-
Mediation Effect: The difference between models is critical: Direct climate solutions return just $1.18 (due to capital intensity and long development cycles), while Indirect enablers — such as MRV platforms or nature data tools — return a much stronger $3.37, underscoring the efficiency of scalable, system-level interventions compared to asset-heavy climate hardware
-
b) By Geography
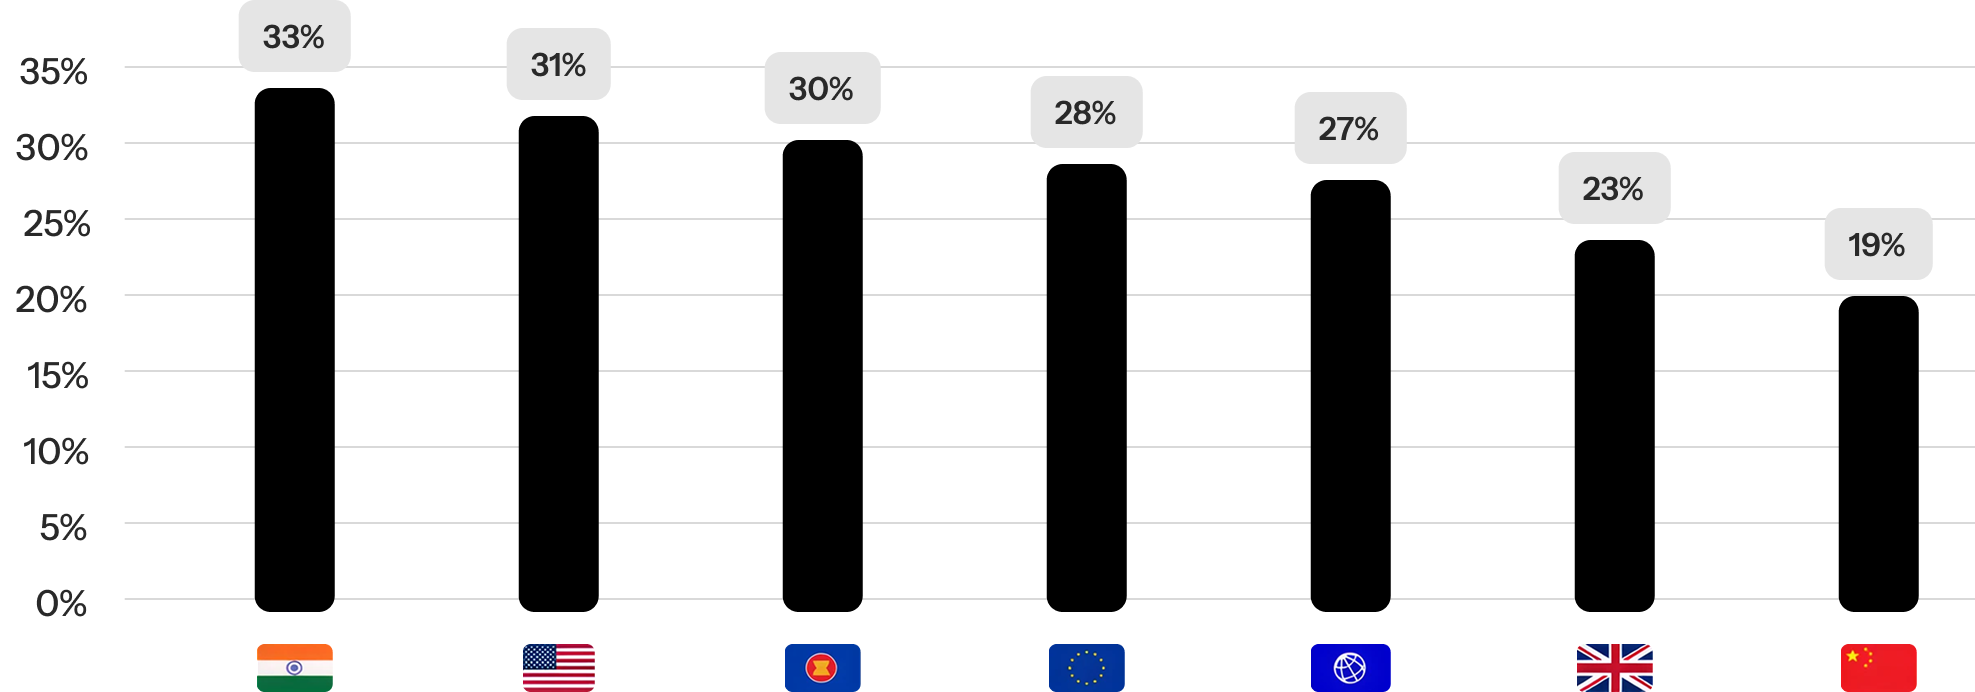
Figure 11: Proportion of Benevolent Disruptors by Geography
Some regions have proven far more fertile ground for scalable, problem-driven business models, offering LPs directional insight into where mission and market objectives are most aligned. Here’s what the data reveals about the geographic concentration of Benevolent Disruptors across global venture funds:
-
India (33%) ranks highest, highlighting the strength of its startup ecosystem in addressing systemic challenges at scale. As an emerging market, India’s Benevolent Disruptors density reflects both unmet needs and innovation that is inherently more impact-aligned
-
USA (31%) remains a powerhouse for venture-backed Benevolent Disruptors, supported by deep capital pools and a broad innovation base. Its high concentration signals continued relevance for LPs seeking scalable problem-solving models, especially in technology-led solutions
-
Southeast Asia (30%) is on par with more mature ecosystems, showcasing strong alignment between digital entrepreneurship and problem-solving. The region presents a compelling opportunity for earlier-stage, high-upside exposure
-
Europe (28%) demonstrates healthy Benevolent Disruptor representation, though, interestingly, slightly lower than global leaders. This may reflect differences in policy incentives directed fundamentally at more direct or obvious solutions, as well as investment heuristics that fail to recognize the outsized potential of indirect solutions, which are more market driven
-
United Kingdom (23%) trails slightly, suggesting a potential mismatch between early-stage capital allocation and Benevolent Disruptors. However, strong talent and sectoral depth mean the right mandates could shift this trajectory, given the right investment heuristics
-
China (19%) shows the lowest proportion of Benevolent Disruptors in the dataset, a result likely shaped by platform centralization, policy constraints, and market access dynamics. While opportunities exist, given it has been a country undergoing significant industrialization in its first wave of development, it is expected to shift in the next phase.
c) By Market Cycle
Figure 12: Rise and Fall of Benevolent Disruptors over the Last 40 Years
Summary: Each major crisis—Black Monday, the Dot-Com crash, the Financial Crisis, and Covid-19—exposed structural weaknesses in existing systems. In response, the share of Benevolent Disruptors in venture portfolios surged, as capital shifted toward companies addressing the cracks those crises revealed.
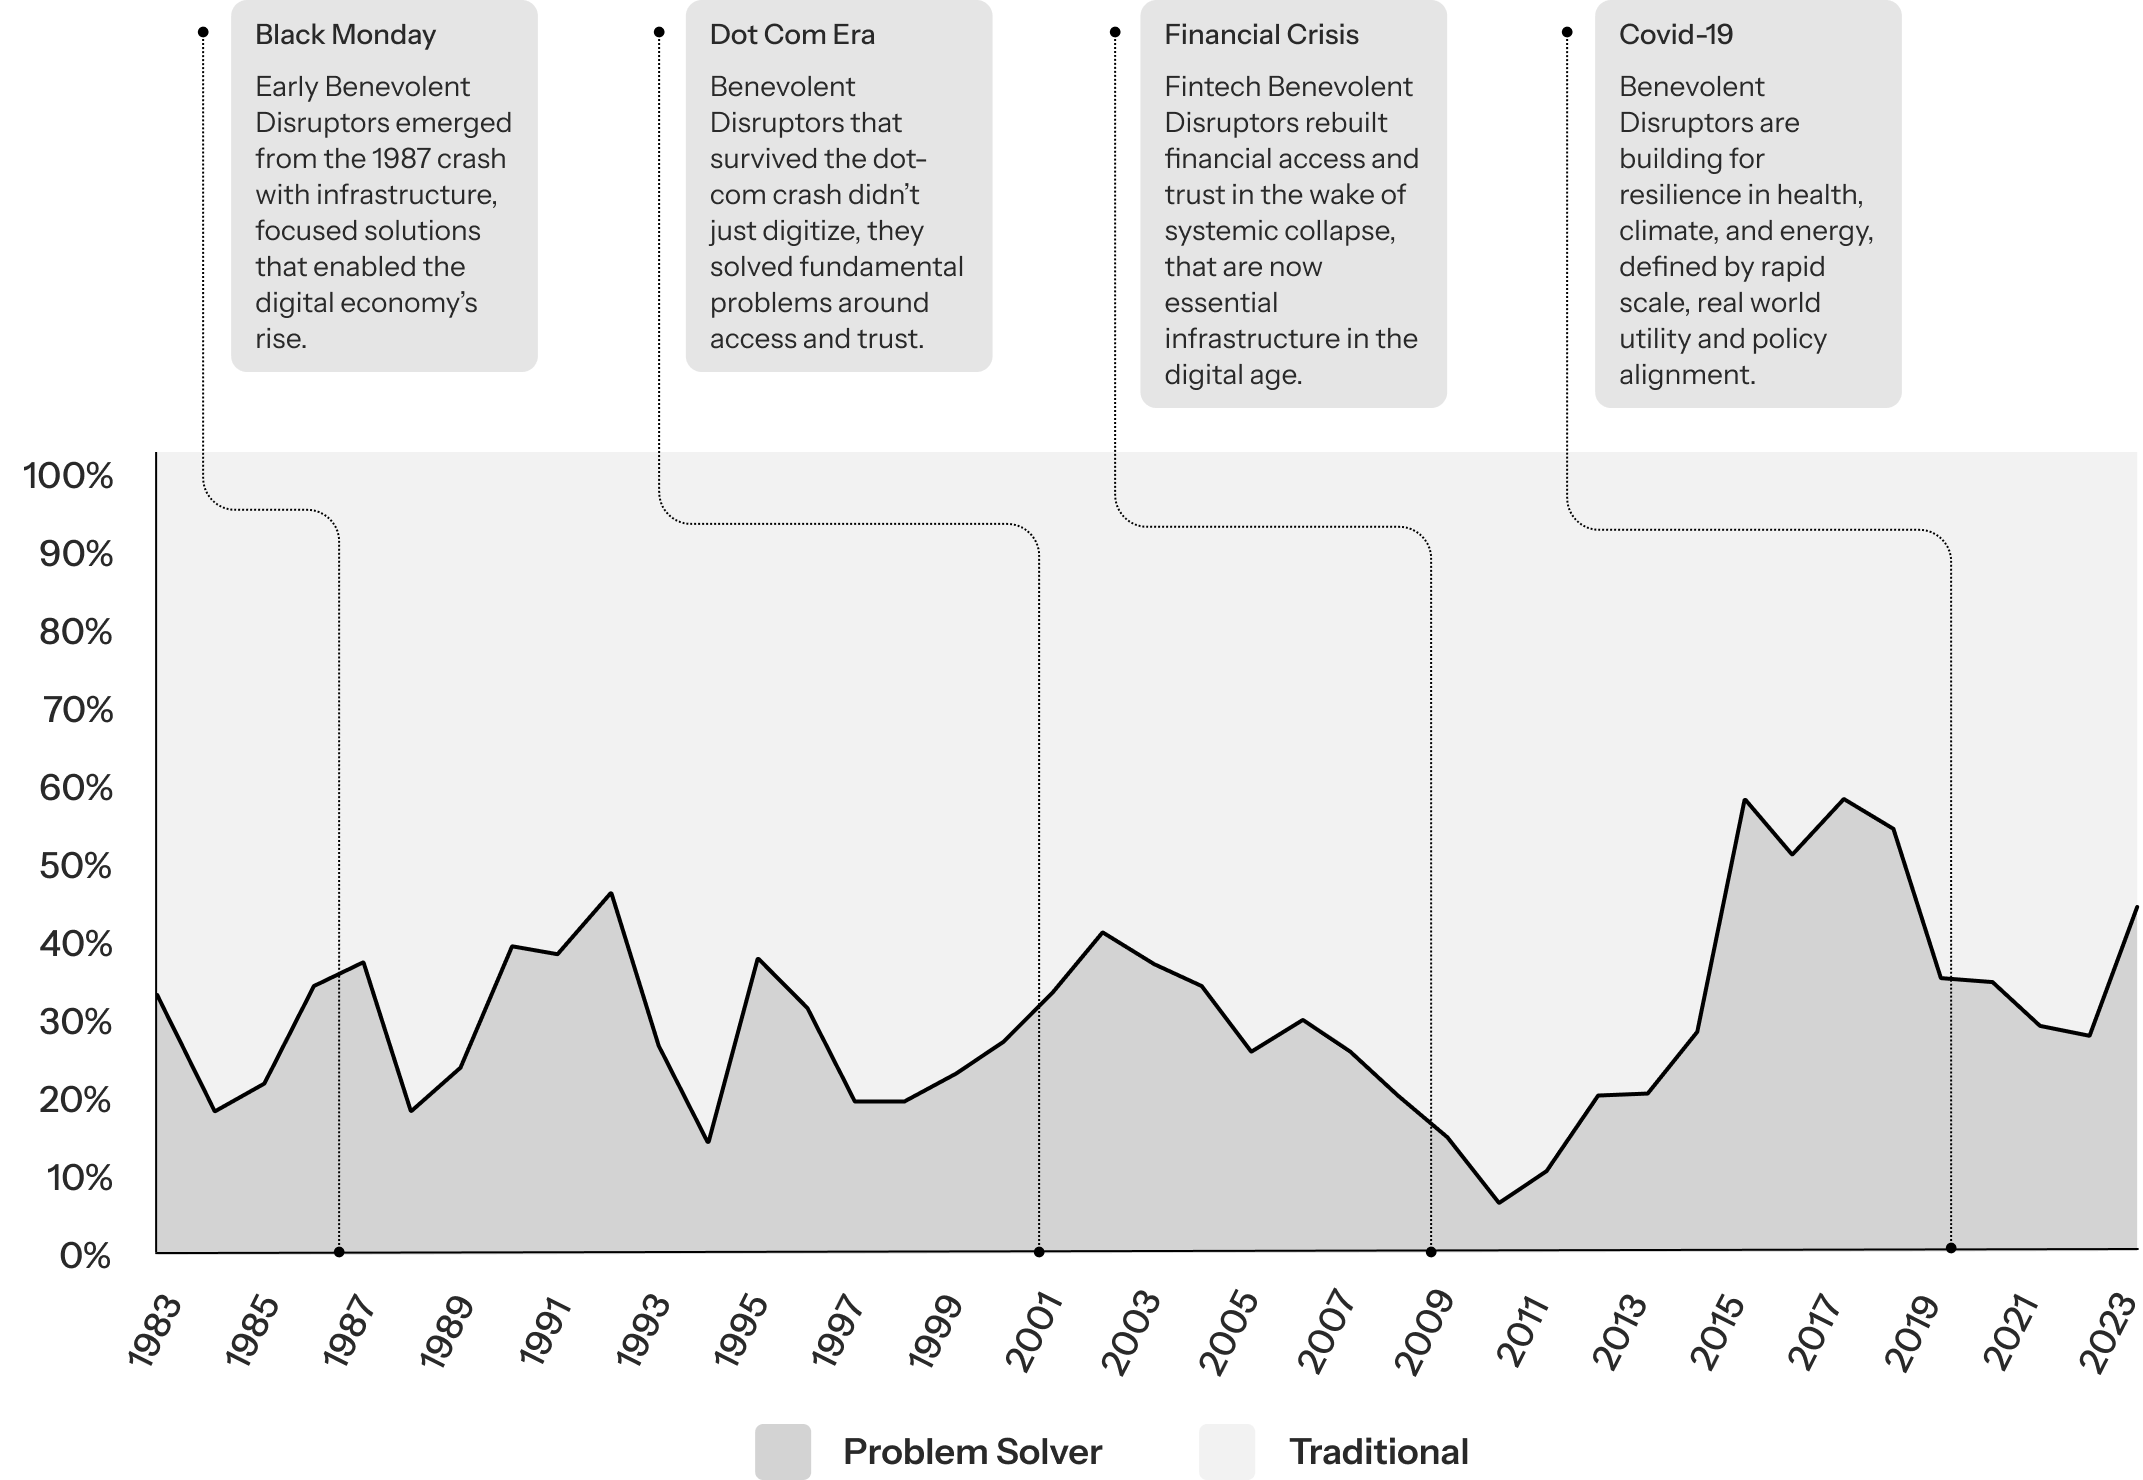
History is clear: during periods of systemic stress, the proportion of Benevolent Disruptors rises meaningfully within venture portfolios. Benevolent Disruption is therefore by nature countercyclical. The data suggests that these companies gain traction when legacy systems begin to fail, offering scalable responses to the kinds of structural challenges that dominate public and policy agendas. In this sense, they function not only as high-upside opportunities, but as a form of strategic insurance against macroeconomic uncertainty.
The data further reveals a striking pattern of Benevolent Disruptor adaptability, as the types of companies that emerge shift depending on the nature of the crisis at hand. Each disruption, whether driven by war, climate shocks, cyber threats, or cost-of-living pressures, brings forth a new wave of entrepreneurs building companies fit for that moment. Time series data shows that capital consistently flows toward these solutions when the status quo fails.
For allocators, these moments are more than macro headwinds; they are structural turning points. Volatility acts as a forcing function, surfacing unmet needs and accelerating demand for ventures that offer concrete, scalable responses. As the data indicates, Benevolent Disruptors consistently rise to prominence in these moments, highlighting a recurring pattern of resilience, responsiveness, and relevance that together represent a catalyst for capital reallocation. This pattern is visible across multiple historical inflection points:
Summary of Key Findings
The data reveals a powerful insight: solving long-term problems isn’t a trade-off to financial success, it’s a pathway to outsized returns. The top-performing companies in VC aren’t just building products; they’re fixing what’s broken in society by leveraging structural demand and scalable business models.
-
Underrepresented, Overperforming: Benevolent Disruptors represent 30% of investments, yet account for 38% of top performing investments, representing a 27% higher chance of hitting an outlier. Benevolent Disruptors don’t just show up more often among top performers, they deliver materially higher returns, generating 51% more value per dollar invested than traditional venture assets. Investors can transform systemic challenges into engines of economic growth that deliver outsized returns.
-
The Hidden Alpha Lies in Indirect Benevolent Disruptors: The Benevolent Disruptors that generate the highest returns (67% higher than traditional venture investments) are those whose business models address systemic problems indirectly, rather than as their core engine of revenue creation. They embed positive change in infrastructure, systems, or tools, often quietly enabling large-scale shifts. Indirect Benevolent Disruptors show up frequently in top-quartile funds, even without being explicitly targeted.
-
Not All Problems Pay Equally: Returns vary widely depending on the problem being solved. Categories like Financial Inclusion and Knowledge Access have outperformed amid global events and paradigms that have fueled them, while current iterations of Healthcare and Climate Tech stray too far into trade-offs, compromising economic returns and scalability for societal value, underwriting capital-intensive technology risks. Subtlety and scalability matter.
-
Geography Matters: Regions like India, Southeast Asia, and the U.S. show stronger alignment between startup ecosystems and Benevolent Disruptors. Benevolent Disruptors emerge where unmet needs and innovation intersect — not where policy or capital alone dominate.
-
Benevolent Disruptors are Countercyclical: Benevolent Disruptors surge in times of crisis — not in spite of turmoil, but because they address the fractures that system-level disruption exposes. From the Financial Crisis to the aftermath of the Covid-19 pandemic, companies solving the problems of the age have consistently shaped the next wave of tech. In today’s turbulent technological and geopolitical climate, investors who back them early aren’t just aligning with society —they’re underwriting big future trends affecting billions of people.